Sponsorship Visibility
Which NASCAR sponsor buys the most exposure for the money. A season of race results joined to news, Reddit and YouTube coverage, scored on published weights, costed against industry estimates, then stress tested to see whether the ranking survived being argued with.
What it had to do
A race team sells the space on a car and a sponsor buys exposure, and neither side can see what the exposure was actually worth. The brief asked a narrow version of that: across one Cup Series season, which sponsors received the most visibility, and which received the most visibility for every dollar spent.
Nobody publishes visibility and nobody publishes what a sponsorship cost. Both sides of the question have to be assembled out of proxies, which means the job was as much about being straight regarding what the numbers are not as it was about producing them.
What I chose
Four sources instead of one, because any single channel measures its own audience rather than the sponsor. Race results came from a Kaggle season dataset, news from Google News RSS with source-tier weighting, Reddit from the PullPush archive after the official API and an RSS route both came up short, and YouTube from the Data API filtered to a publishing window around each race so that off-season videos could not drift into the count.
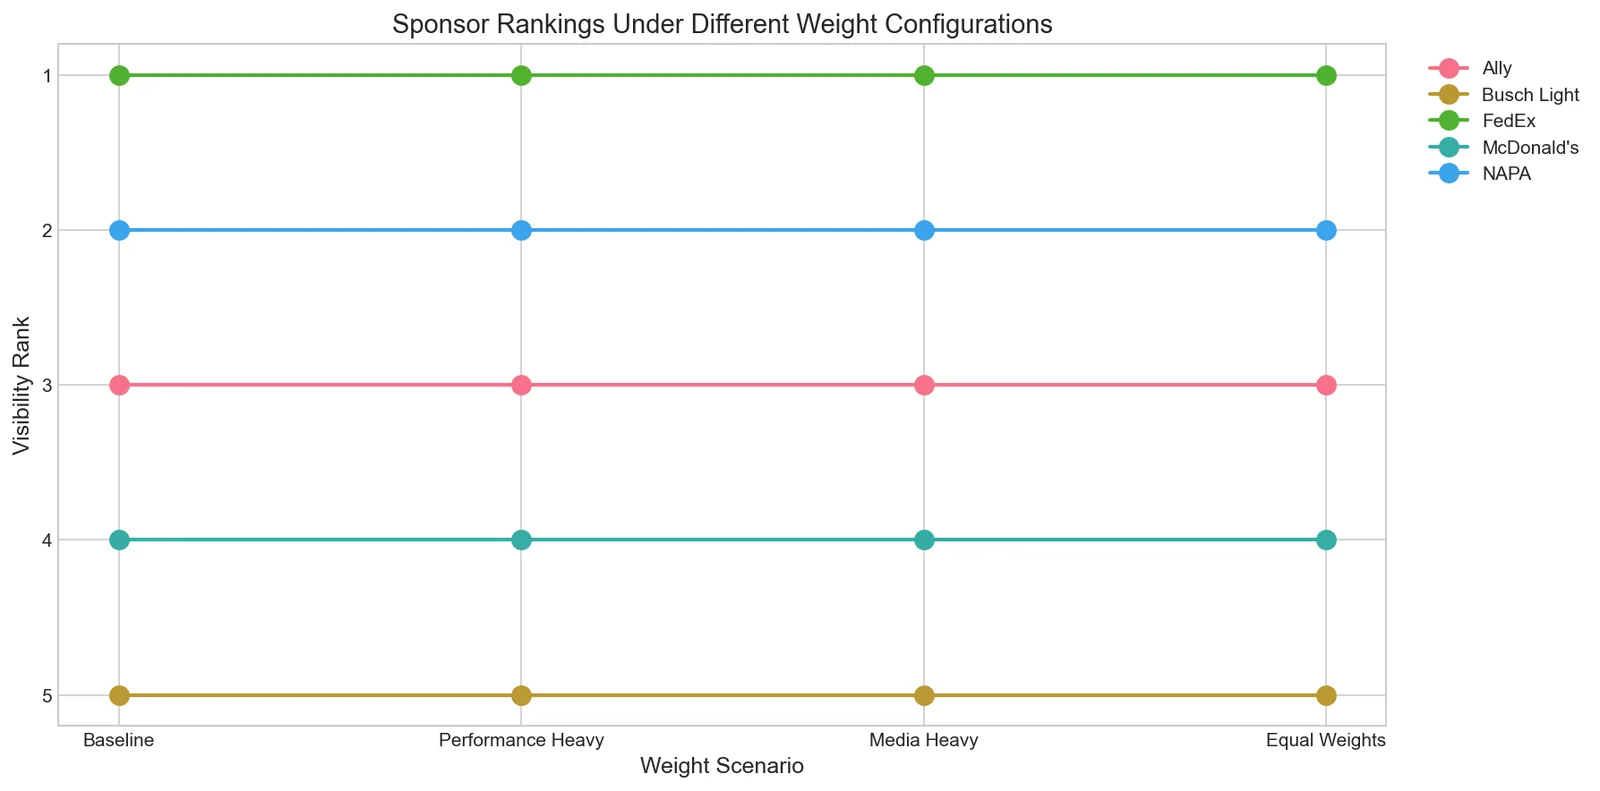
A composite score with weights I set and published rather than weights fitted to the data. Race performance carries 40%, media coverage 30%, social engagement 20%, and wins and playoff races the last 10%. Fitting the weights would have looked more rigorous and been less honest, because the per-race correlations were too weak to support a regression, so a fitted model would have been noise wearing a coefficient. Declared weights can be argued with, which is the point of declaring them.
Everything is normalised onto 0 to 100 before it is combined. Finish position is inverted so that first place scores highest, YouTube views are log-transformed so that one viral clip cannot decide a season, and wins and playoff appearances are flags rather than counts.
How it works
The dataset is 180 rows, one per sponsor per race, covering 5 primary sponsors across all 36 races of the 2024 season. It has no missing combinations and no null values, and the merge is checked rather than assumed: 540 merged values were reconciled row by row against the files they came from, with race numbering aligned across the four sources by date.
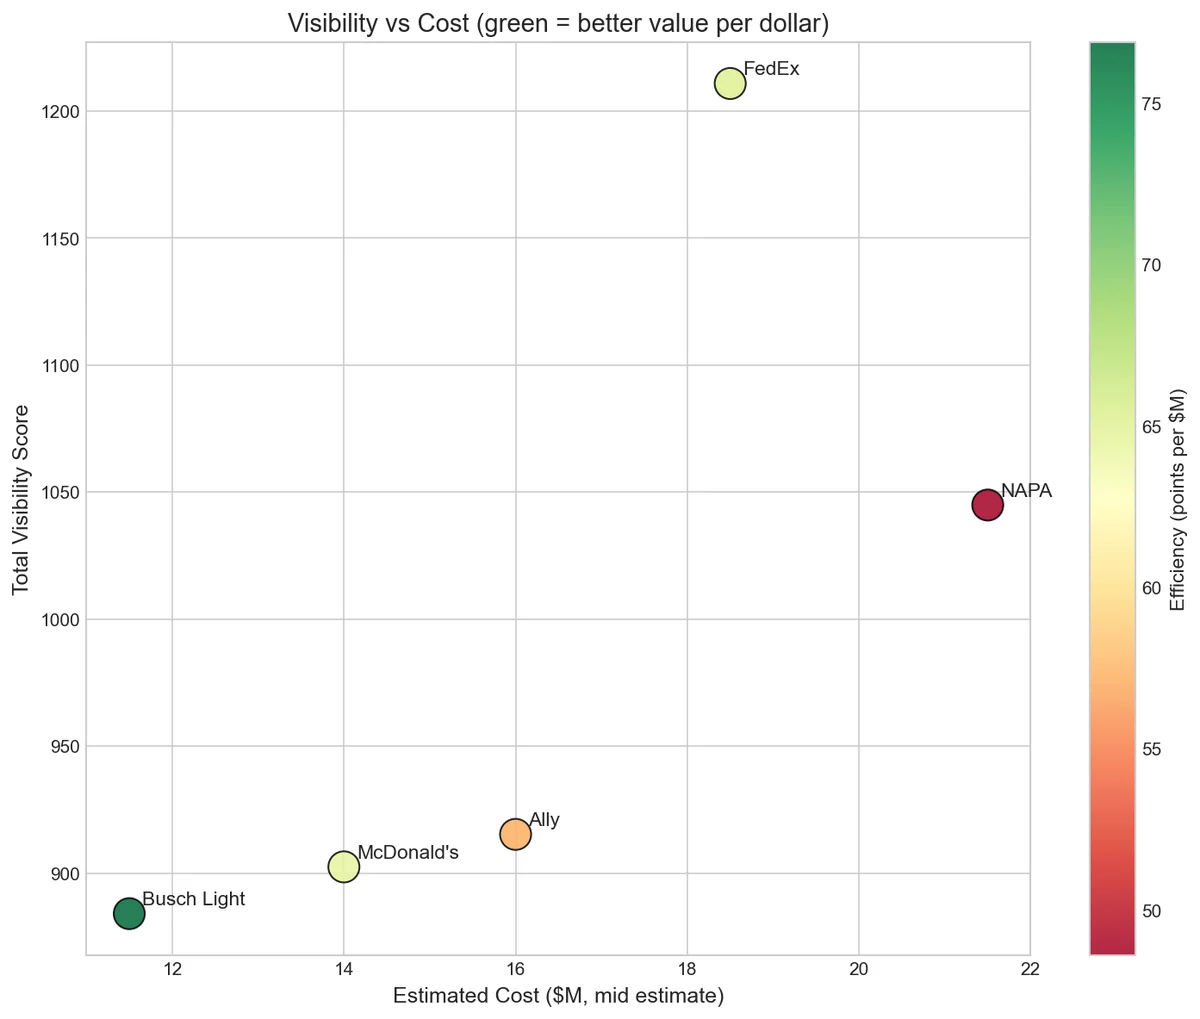
Season visibility is the sum of the weekly scores. Efficiency is that total divided by an estimated season cost. FedEx takes raw exposure on 1,211 points, and Busch Light takes value at 76.9 points per million dollars against FedEx's 65.4. The recommendation was FedEx as the all-round buy, since it is top three on both measures, with Busch Light as the value play.
The analysis ends in a written report and a ten-slide deck, both generated from the notebooks with python-pptx rather than assembled by hand, so a correction upstream reaches the deliverable instead of quietly diverging from it.
What it cost
Coverage is sparse, and how you treat that decides the answer. Reddit returned data for 35% of sponsor-race combinations and news for 46%. Every gap is filled with zero, because for these sources a zero is a measurement rather than a hole: nobody posted about that sponsor that weekend. That is defensible and it does flatten the difference between silence and a failed collection, which is why the data quality report says so in as many words.
The costs are estimates drawn from industry reporting, not contract values, so every efficiency figure inherits that uncertainty. That is also why the sensitivity work matters more here than the headline table does.
Validation is directional rather than causal. At season level, better finishes, more wins and more laps led all track higher visibility, with correlations between 0.53 and 0.94. That is a consistency check on the score, not evidence that the score measures what a sponsor cares about.
The ranking did survive being argued with. The exact order held under four different weightings, and efficiency moved at most one position across the full low-to-high range of the cost estimates. One season and five sponsors is still one season and five sponsors.
What I'd change
Set the weights with the team in the room. Choosing them, publishing them and stress testing them is the best you can do working alone, but the weights are the one judgement in the model a sponsor would genuinely want to argue about, and that argument is far more useful before the analysis than after it.